Long day, boozy evening.
This came up during dinner discussions. It’s still so good.

It could, apparently, be the Best Cartoon Ever. I have to agree.

Long day, boozy evening.
This came up during dinner discussions. It’s still so good.
It could, apparently, be the Best Cartoon Ever. I have to agree.
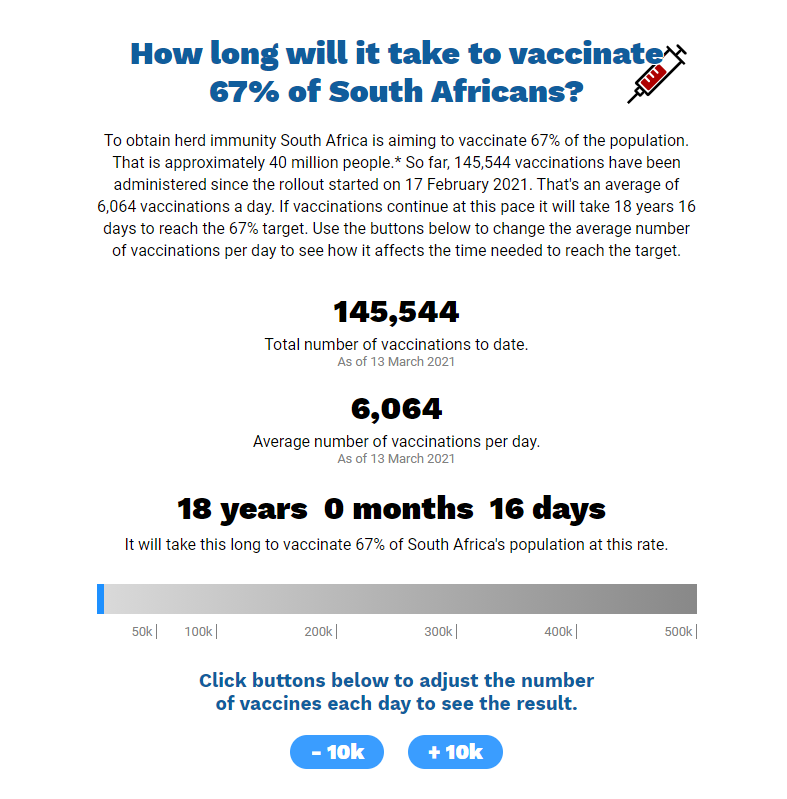
I’ve been doing some rudimentary calculations and I reckon that we’re just 9 days away from what many people would call “1 year of lockdown”. Sure, when we first started there was a lot more locking down than there is now. We weren’t allowed to go out at all. Now, we’re not allowed to go out between midnight and 4am. But the State of Disaster in this often Disastrous State is still in force and will continue to be for at least another month (and obviously waaaay beyond that, too). Everyone is fully expecting a third wave of infections here, probably around May or June. And despite the government’s best promises, I’m not confident of getting a vaccination much before the end of the year. And that’s hugely optimistic, according to this useful tool.
It’s a gloomy picture, exacerbated by the miserable weather today, the horrendous traffic (ironically brought about by the easing of lockdown) and by the return of loadshedding which popped in last week to say hi and has decided to stay until at least Wednesday. So, amidst the rain, the jams, the infections and the lack of electricity, it is – once again – amazing to me that this country continues to… well… to continue continuing.
Well. Mostly, anyway. I’ve just taken a call from the place that is servicing my car today to tell me that they can’t do any wheel alignments (I wanted four done) (or one big one) until they get their wheel alignment machine mended because loadshedding has broken it.
Frustrating.
But my major issue is still the amount that we are contributing to the economy via this new house. A blocked drain and a leaking pipe are today’s exciting events. The plumbers are digging through bathroom walls and trying to break as few tiles as possible, but due to the terrible way that the original pipework was installed, that’s no easy task.
Right. Let me go and see how they are getting on with their work.
After all, it’s not like there’s any rush to go and fetch the car or get a vaccination, is it?
The work on the house continues with some painting, some lighting and some extra additions here and there. The pool is full, but it’s dark and wet (outside, not the pool), so I can’t do my after photo just yet.
Here’s one from yesterday then – a Citrus Swallowtail (Papilo demodocus) in the back garden:

We see a lot of these around (they’re probably the second most common butterfly locally after the Acraea horta) but they never stop moving: they’re flitty and flighty, so I’ve never managed to get a shot before. This one actually settled for a few moments, although it never stopped moving its wings (rapidly) for a single second and so I was forced to use high speed shooting in Sports Mode on the camera to get a decent image (and about 74 poor ones).
There are actually a couple of other reasonable shots, but I haven’t got as far as Lightroom yet, because the work on the house continues with some painting, some lighting and some extra additions here and there (I think I mentioned this), so those might have to wait for another day.
This is taking a lot longer than we anticipated.

Our water bill is going to be MASSIVE this month. And I know that I promised you before and after images, but there is no after at the moment. Because it’s taking SOOOO long to fill.
It’s not even a big pool.
OK, this was going to be a longer post and then I had a hell of a day and now I’ve given up on anything except braai’ing and beer, so it’s now going to be a shorter post.
However, my point still stands.
And the point that still stands is this:
If you have data to present, it doesn’t matter how interesting or dull they are, presenting them in an engaging manner can still capture the attention of your audience.
For example, you might have some really dull data about lots of different types of the colour grey which you need to share with your colleagues. A pantone colour table is not going to be the way to do it. No-one cares about the difference between light elephant and rainy sky. However, if you… if you… erm… actually, this is a poor example, because off the top of my head, I can’t think of an entertaining way of presenting data about several differing tones of grey.
If only there was something…
But never mind.
Here’s the data I want to share today. And what an incredble way of doing it.
Yesterday marked 10 years since the 2011 tsunami in Japan, and I was sent this – a snapshot of all the earthquakes in and around Japan in 2011. Japan is pretty seismologically active, so there’s plenty going on, but it’s still rather grey data, right? Not if you present them like this.
You’ll need your sound on and you’ll want to watch (at least) until the 11th March (about 0:45), for obvious reasons. Keep your eye on the event count in the bottom left corner.
It’s quite something, isn’t it? What a way to present fairly basic data in a form that is easy to understand at any age and with any degree of expertise. And what a way to demonstrate the sheer terrifying scale of that earthquake on 11th March 2011.
If you want to view the whole year, it’s on Youtube here.